How to scrape OpenTelemetry Data with Prometheus in Python
Learn how to visualize custom OpenTelemetry metrics in Grafana

Opentelemetry
I create a python venv and install opentelemetry
mkdir test && cd test
python3 -m venv .
source ./bin/activate
pip install opentelemetry-distro
pip install opentelemetry-exporter-prometheus
I create main.py that has the necessary libraries and assign a IP and port for my metric http server.
/test/main.py
#https://opentelemetry.io/docs/languages/python/exporters/
import time
from prometheus_client import start_http_server
from opentelemetry import metrics
from opentelemetry.exporter.prometheus import PrometheusMetricReader
from opentelemetry.sdk.metrics import MeterProvider
from opentelemetry.sdk.metrics.export import PeriodicExportingMetricReader
from opentelemetry.sdk.resources import SERVICE_NAME, Resource

resource = Resource(attributes={
    SERVICE_NAME: "Counter"
})
start_http_server(port=5001, addr="192.168.122.24")
reader = PrometheusMetricReader()
provider = MeterProvider(resource=resource, metric_readers=[reader])
metrics.set_meter_provider(provider)
meter = metrics.get_meter_provider().get_meter("getting-started", "0.1.2")

## Create metric
print("Count to three")
counter = meter.create_counter("counter")
counter.add(1)
print("1 - Waiting 5 Sec")
time.sleep(5)
counter.add(1)
print("2 - Waiting 5 Sec")
time.sleep(5)
counter.add(1)
print("3 - Done.")
time.sleep(5)
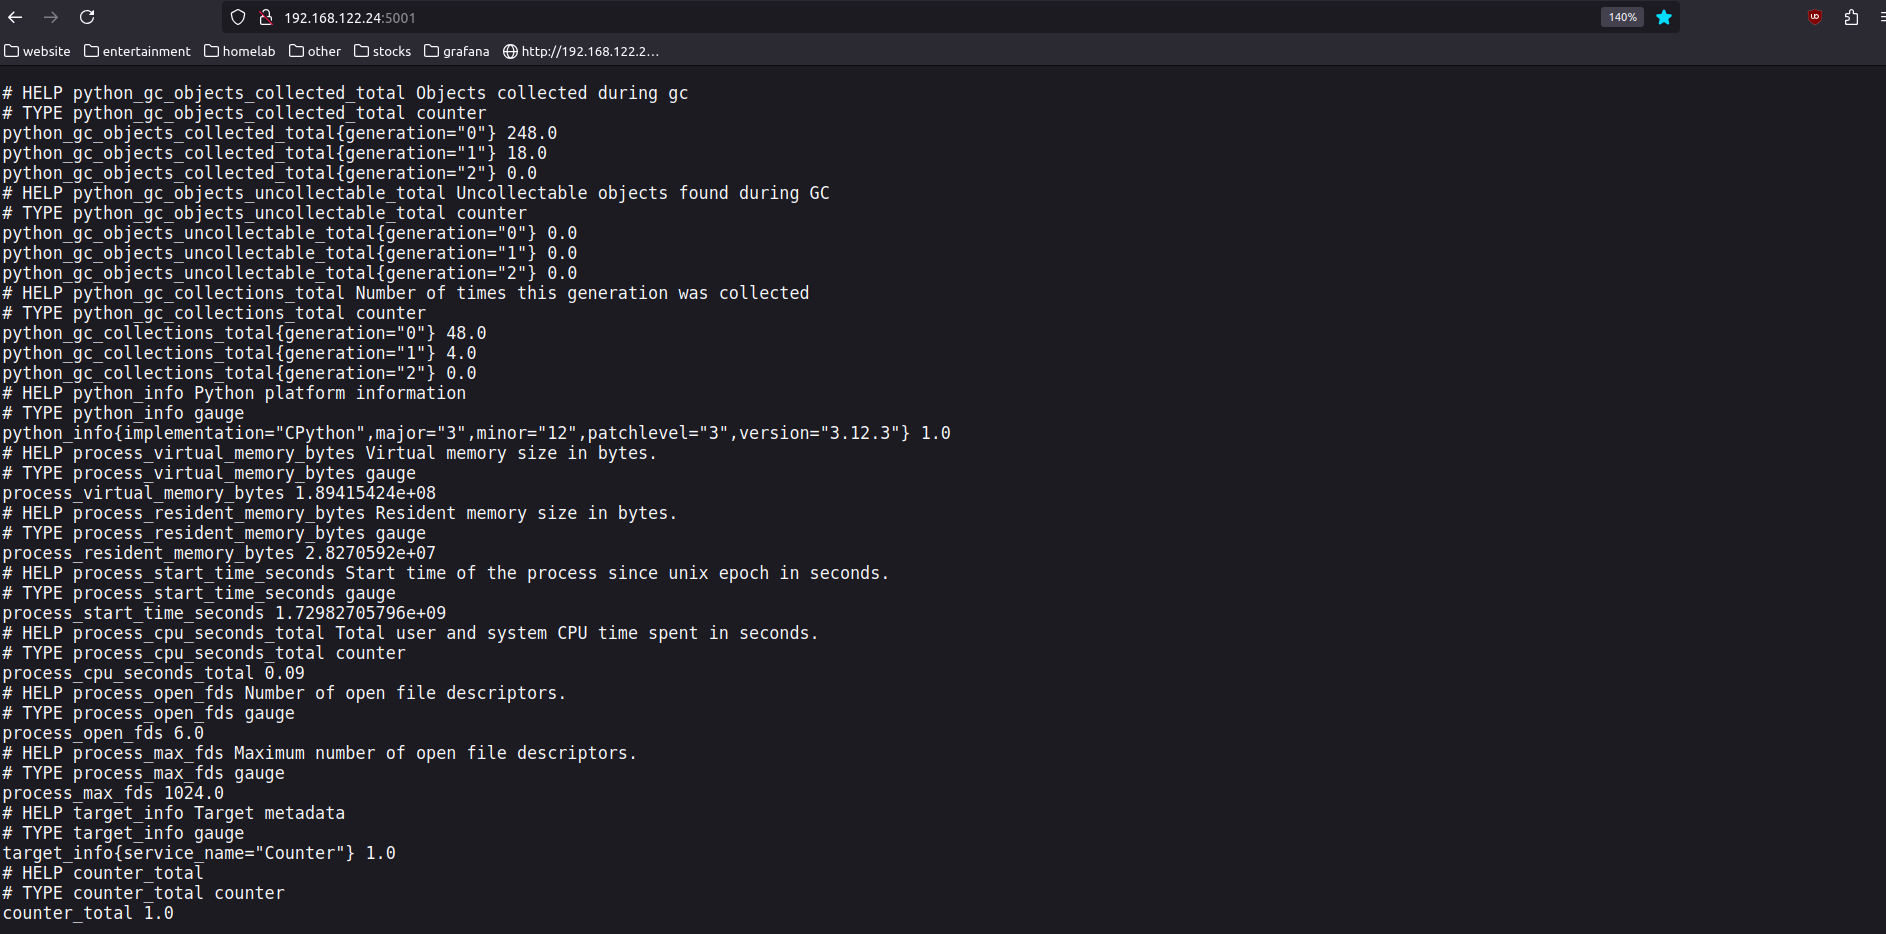
I use python main.py to run the script and check 192.168.122.24:5001
if my metric is listed.

Prometheus
I install Prometheus and add my metric http server as static config so Prometheus can scrape it.
docker pull prom/prometheus
code prometheus.yml
mkdir /tmp/prometheus
chown 65534:65534 /tmp/prometheus #change folder owner to nobody otherwiser docker is not allowed to access it
docker run --name prometheus -v ./prometheus.yml:/etc/prometheus/prometheus.yml -v /tmp/prometheus:/prometheus -d -p 9090:9090 prom/prometheus
prometheus.yml
global:
  scrape_interval: 15s
  evaluation_interval: 15s
alerting:
  alertmanagers:
    - static_configs:
        - targets:
rule_files:
scrape_configs:
  - job_name: 'Pythoncounter'
    static_configs:
      - targets: ['192.168.122.24:5001']
Under 192.168.122.24:9090/targets I check if my metric http server is scraped. In this case I do not have to change the default directory which is /metrics.

Grafana
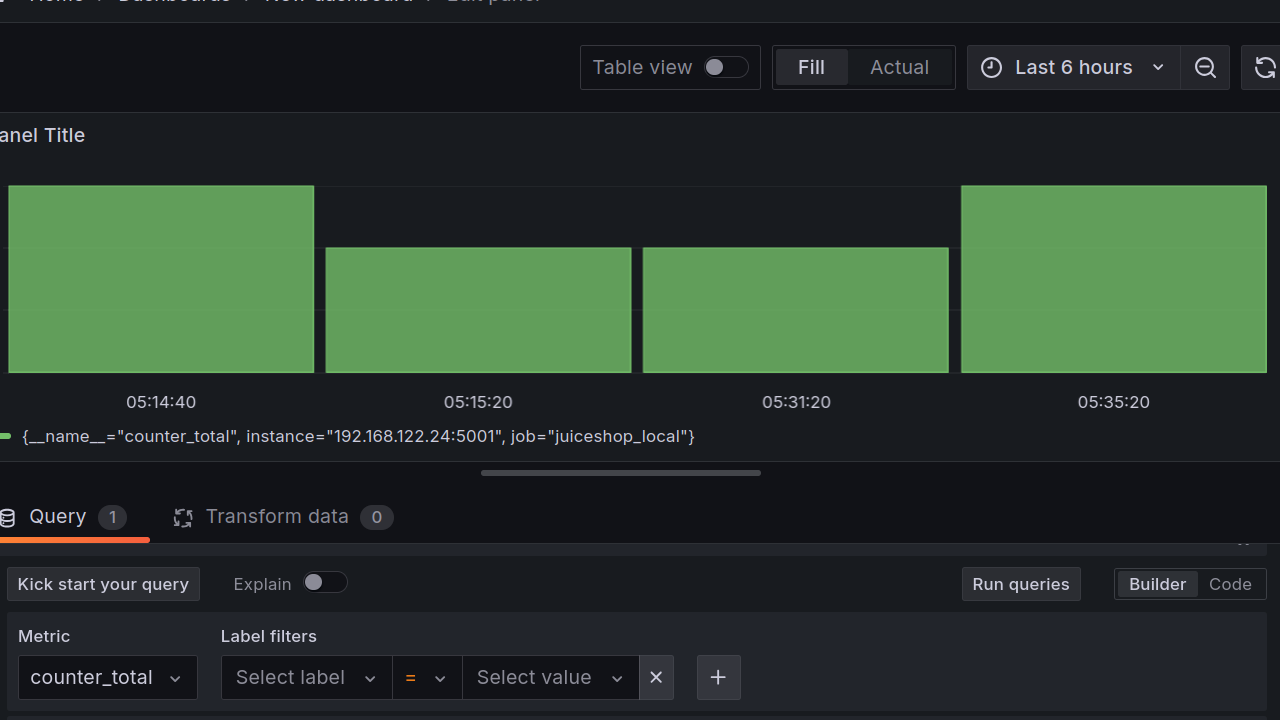
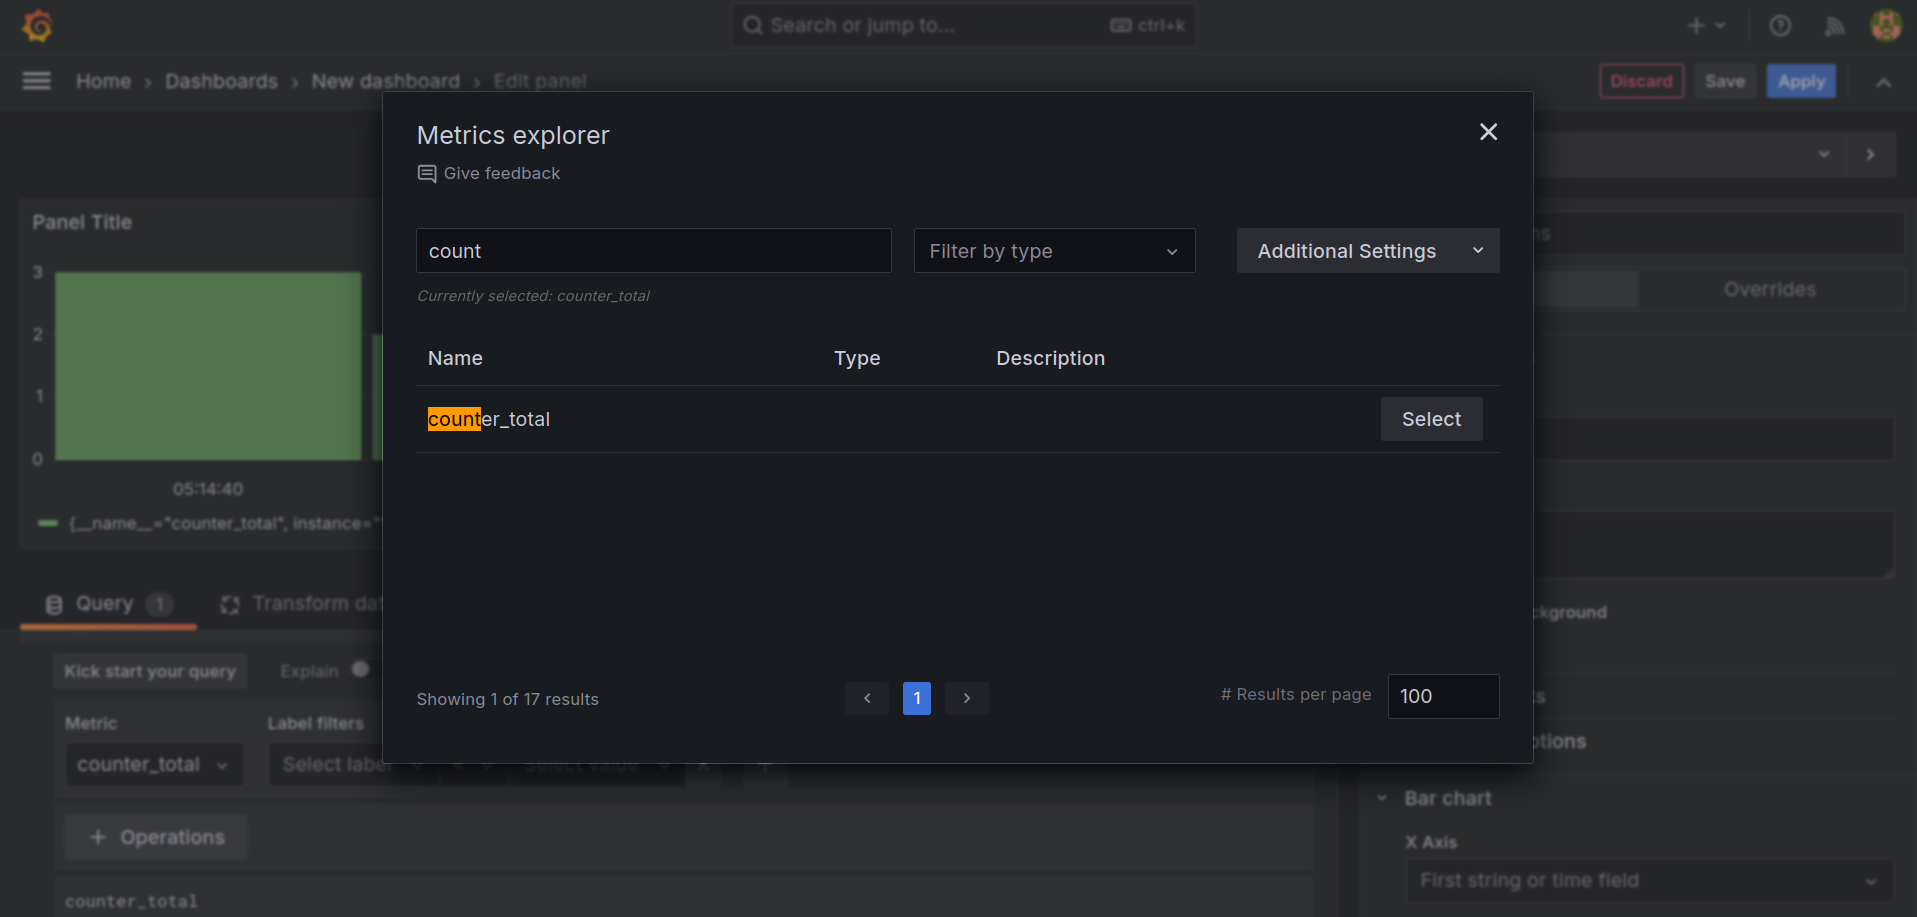
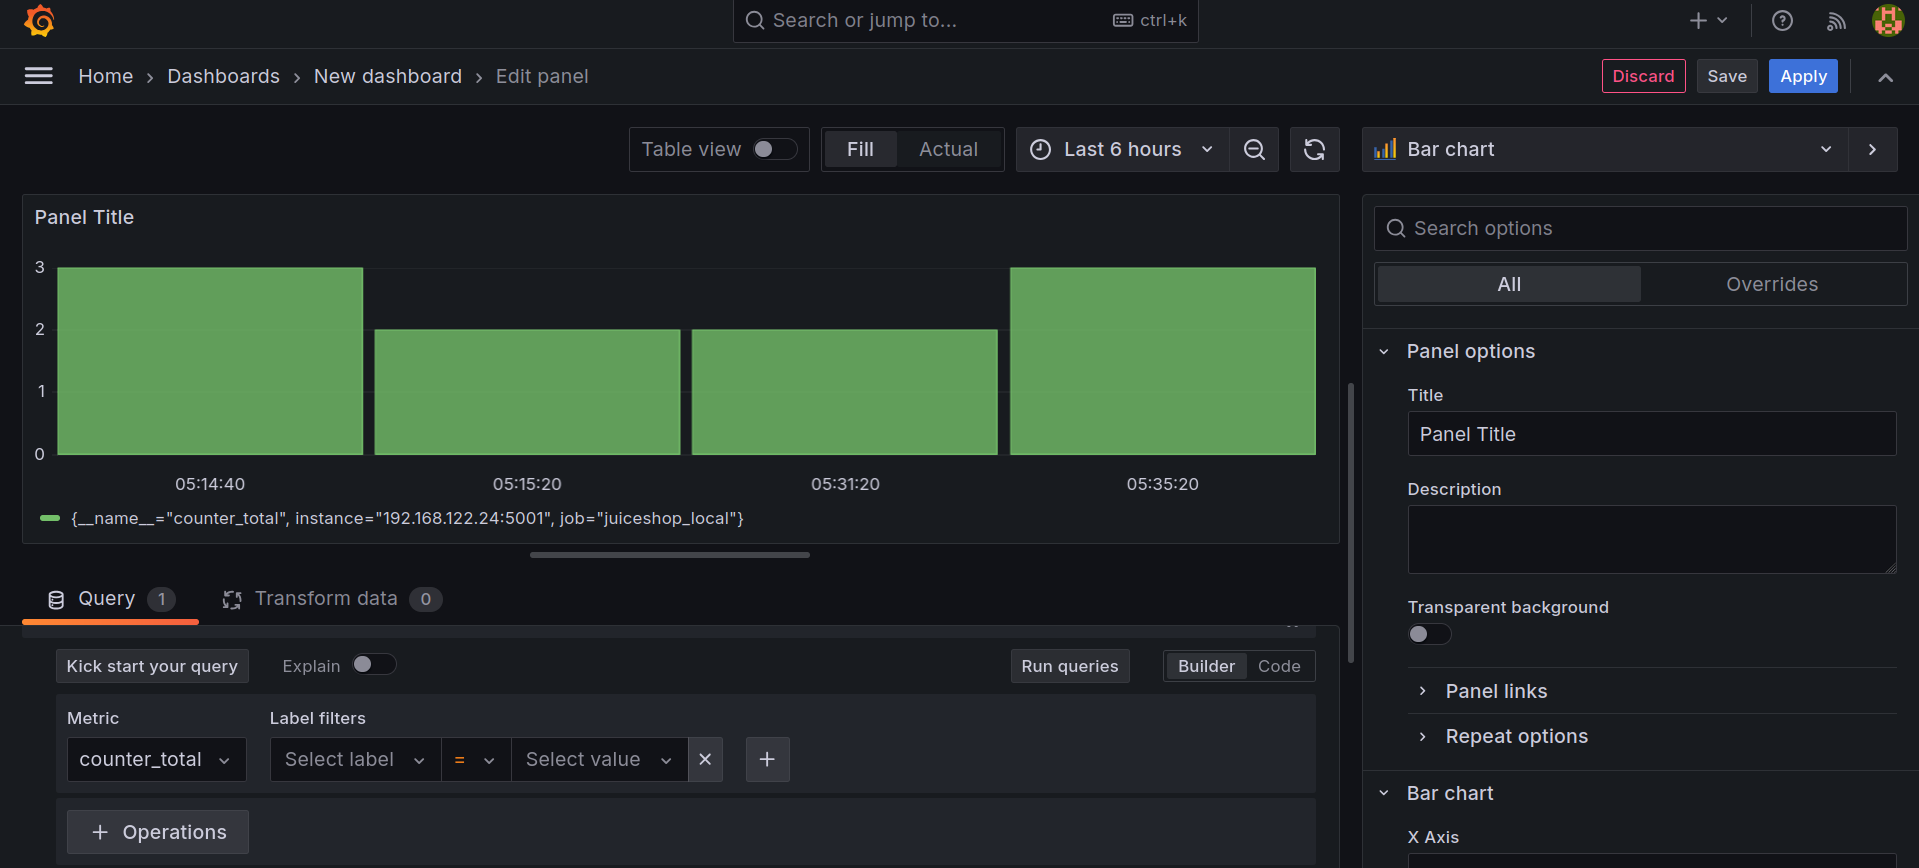
I choose a new data source and select my Prometheus query. In the metrics explorer I search for counter.

And thats it!

I found this Blog Article really helpful for understanding OpenTelemetry in Python.