How to visualize SNMP in Grafana with InfluxDB
Learn how to visualize the devices uptime
SNMP Agent / Server
I create a community on my Router 192.168.122.205 so I can query SNMP.
ip access-list standard GRAFANA
    permit host 192.168.122.24
    snmp-server community public rw GRAFANA
On my SNMP Server 192.168.122.24 I install the SNMP packets.
sudo apt install snmp snmpd snmp-mibs-downloader
code /etc/snmp/snmp.conf #comment out mibs to enable MIB descriptions instead of OID
snmpwalk -v 2c -c public 192.168.122.205 #SNMP Query
InfluxDB
I create a new bucket and add a telegraf configuration for SNMP.
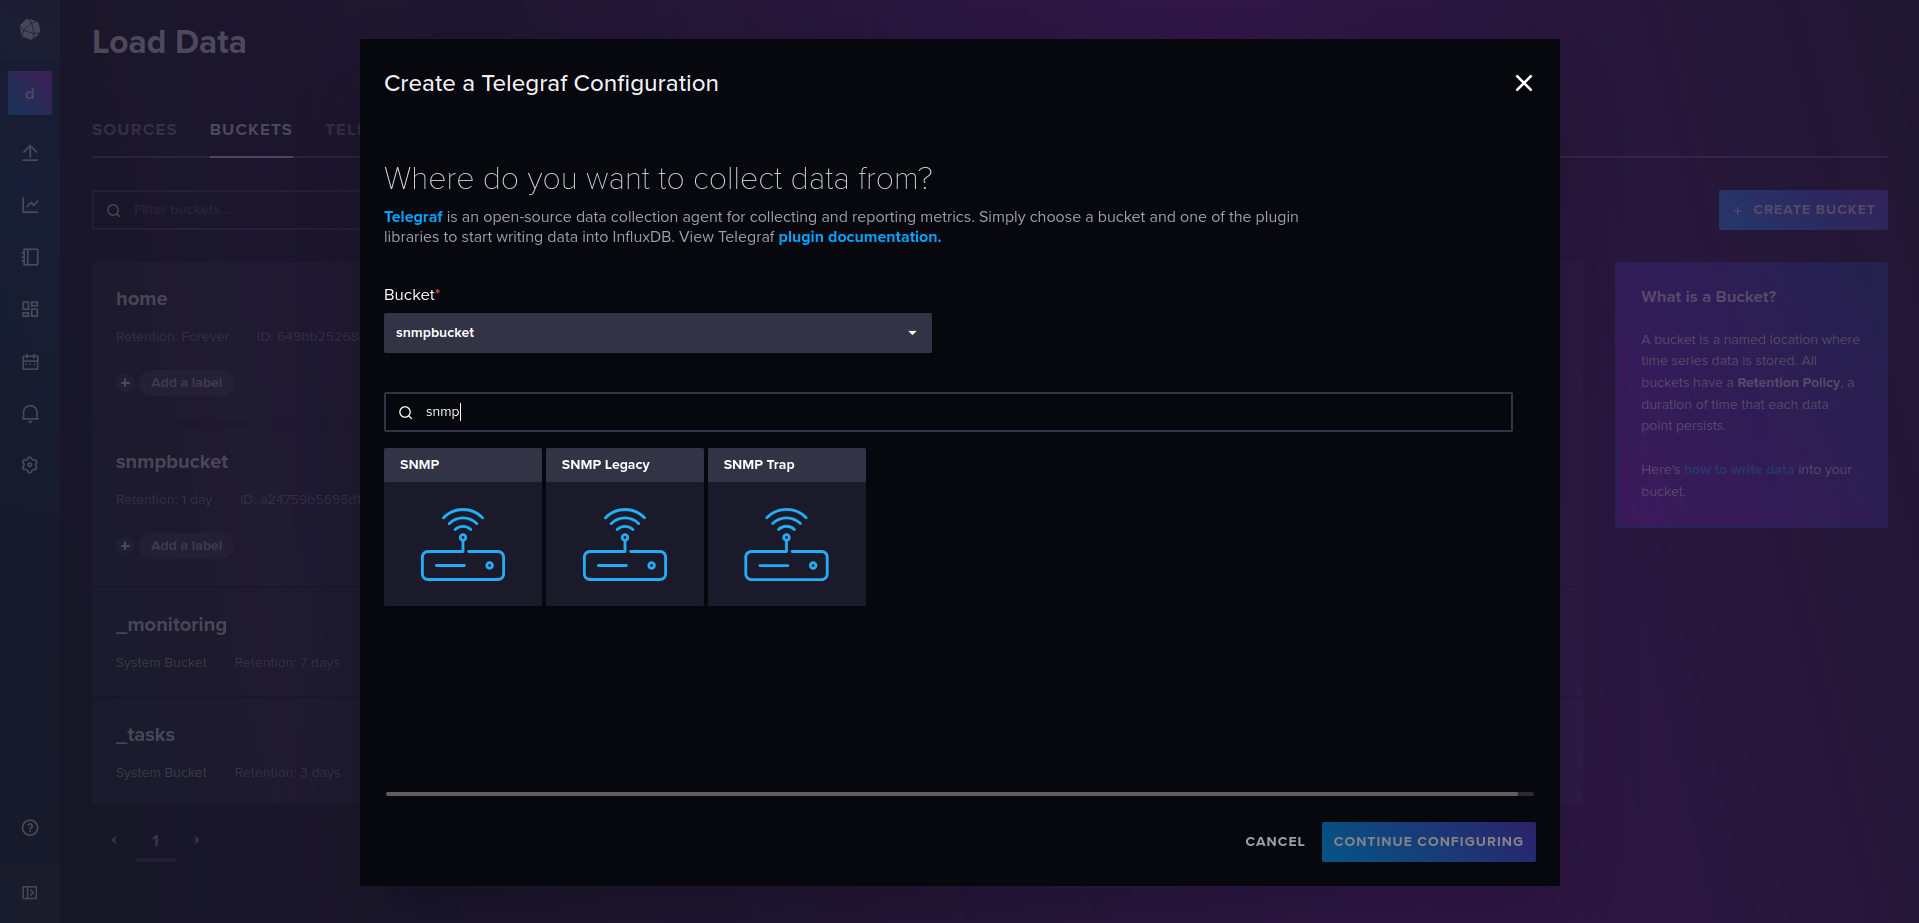
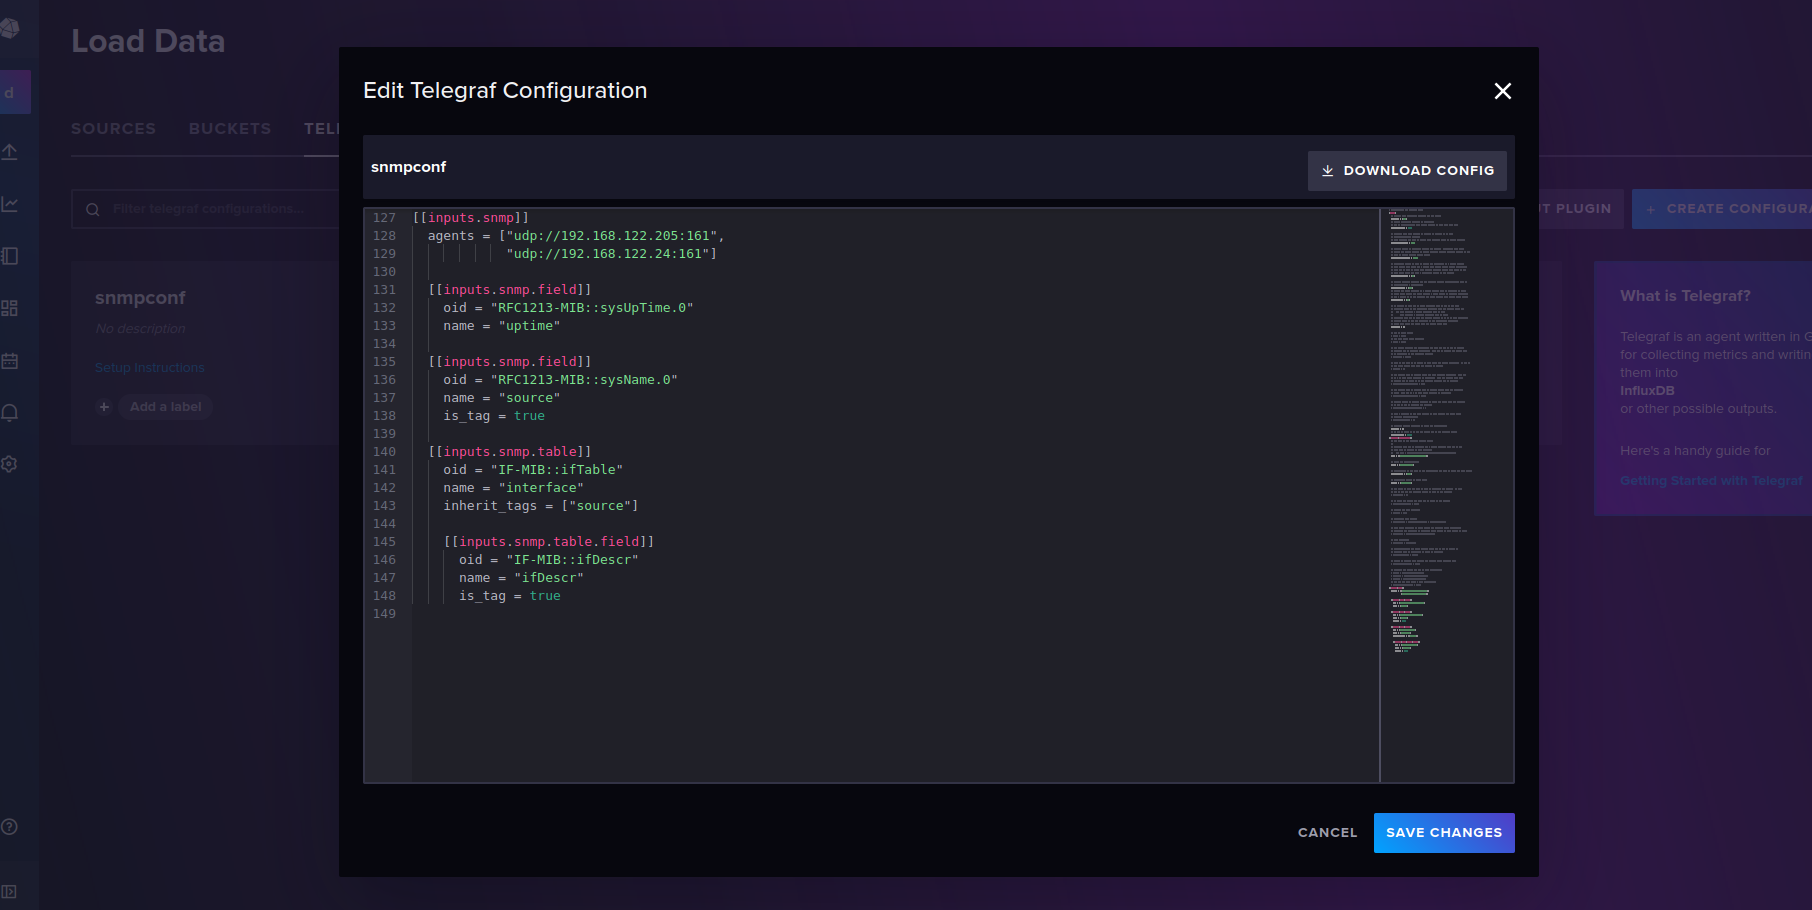
I add the devices that I want to query as agents and follow the wizard to start telegraf.
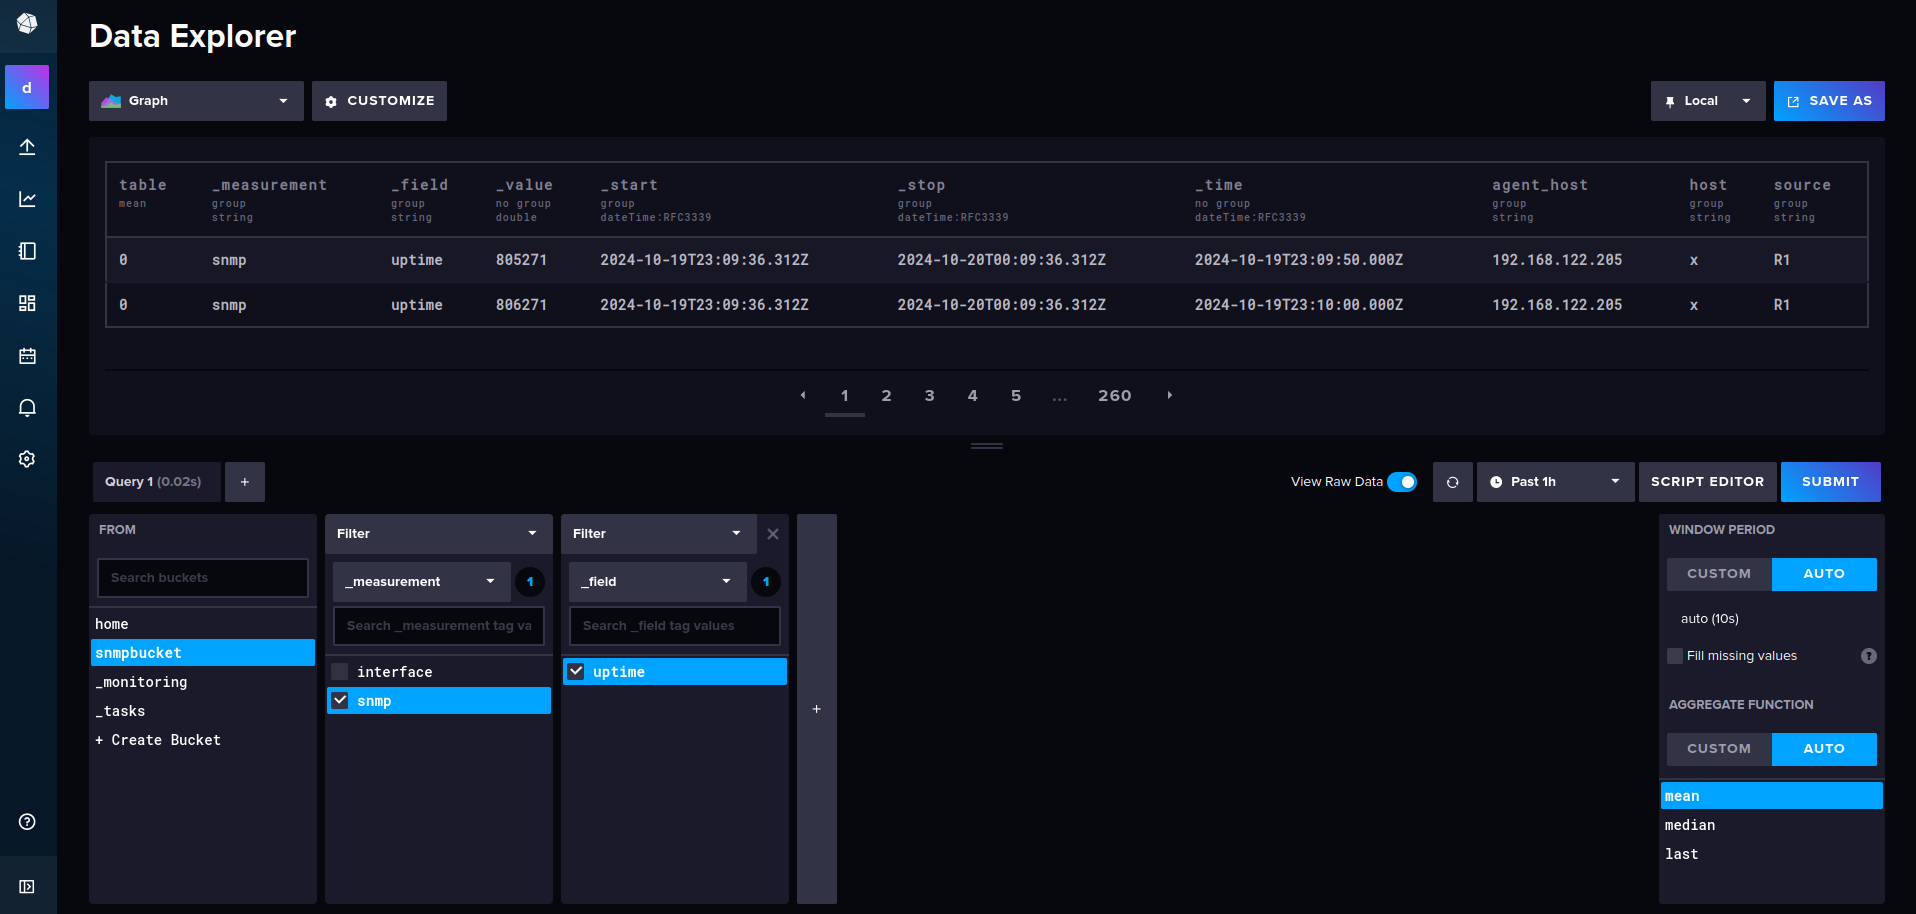
In the bucket I can now query the SNMP data.
Grafana
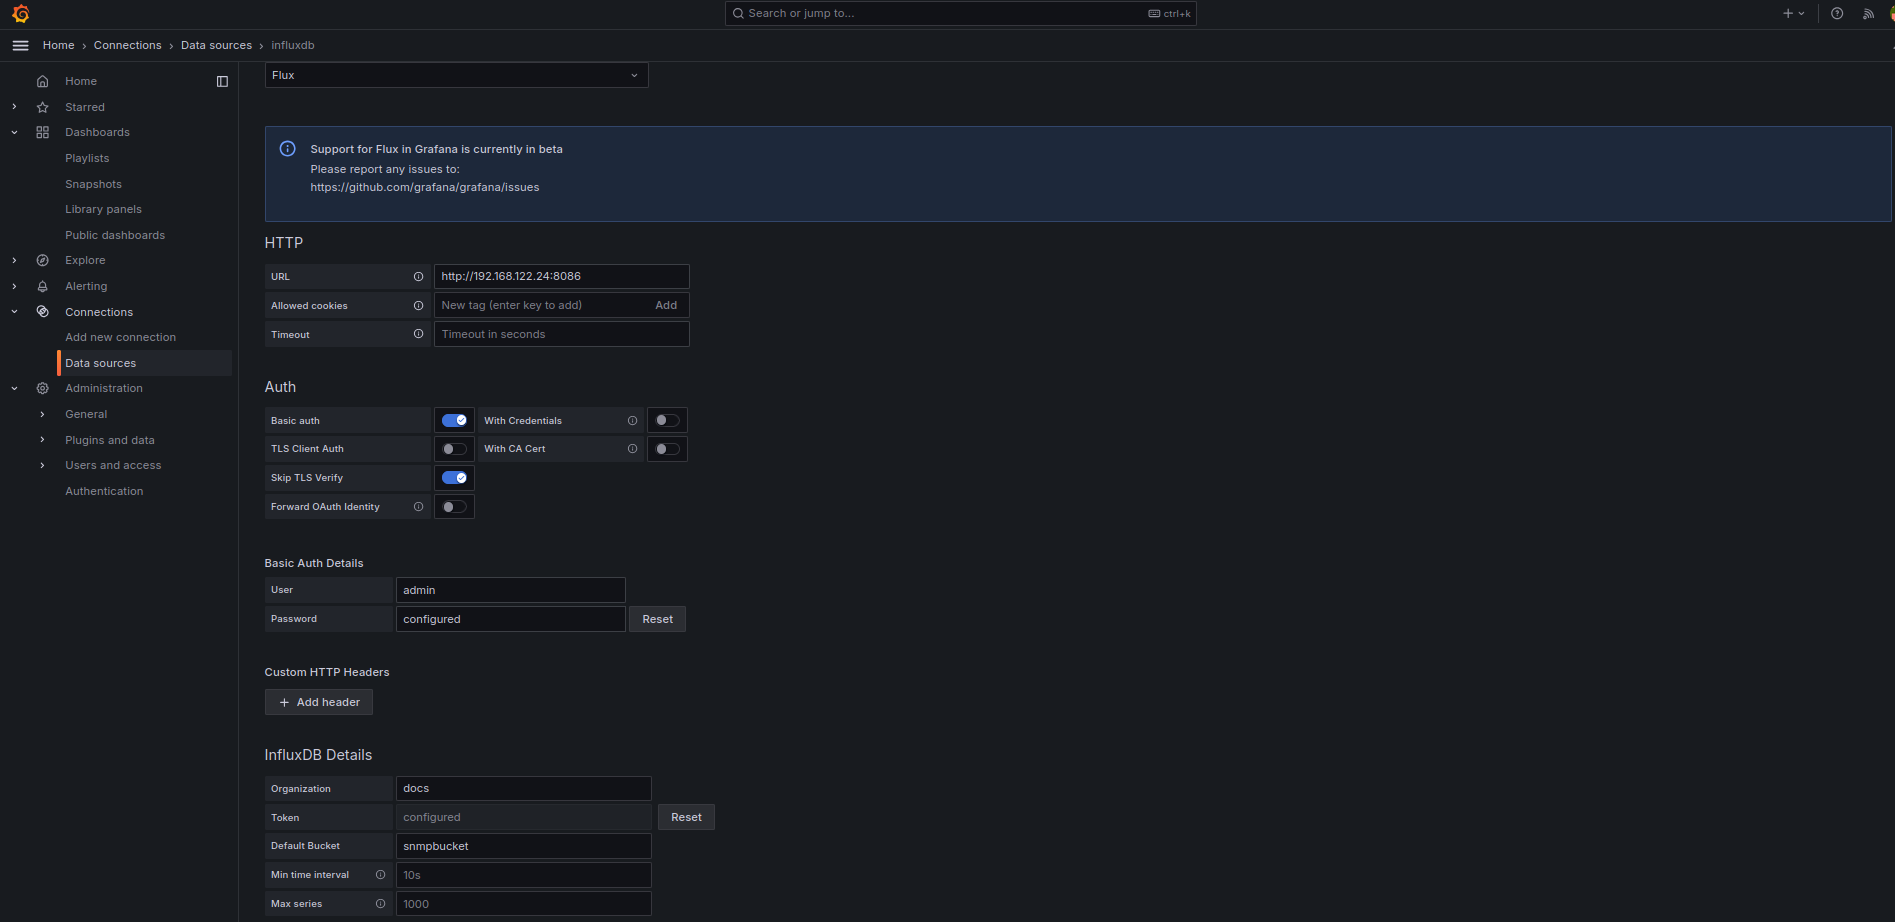
I add my InfluxDB as datasource.
I add a new visualization and filter the fields that I want.
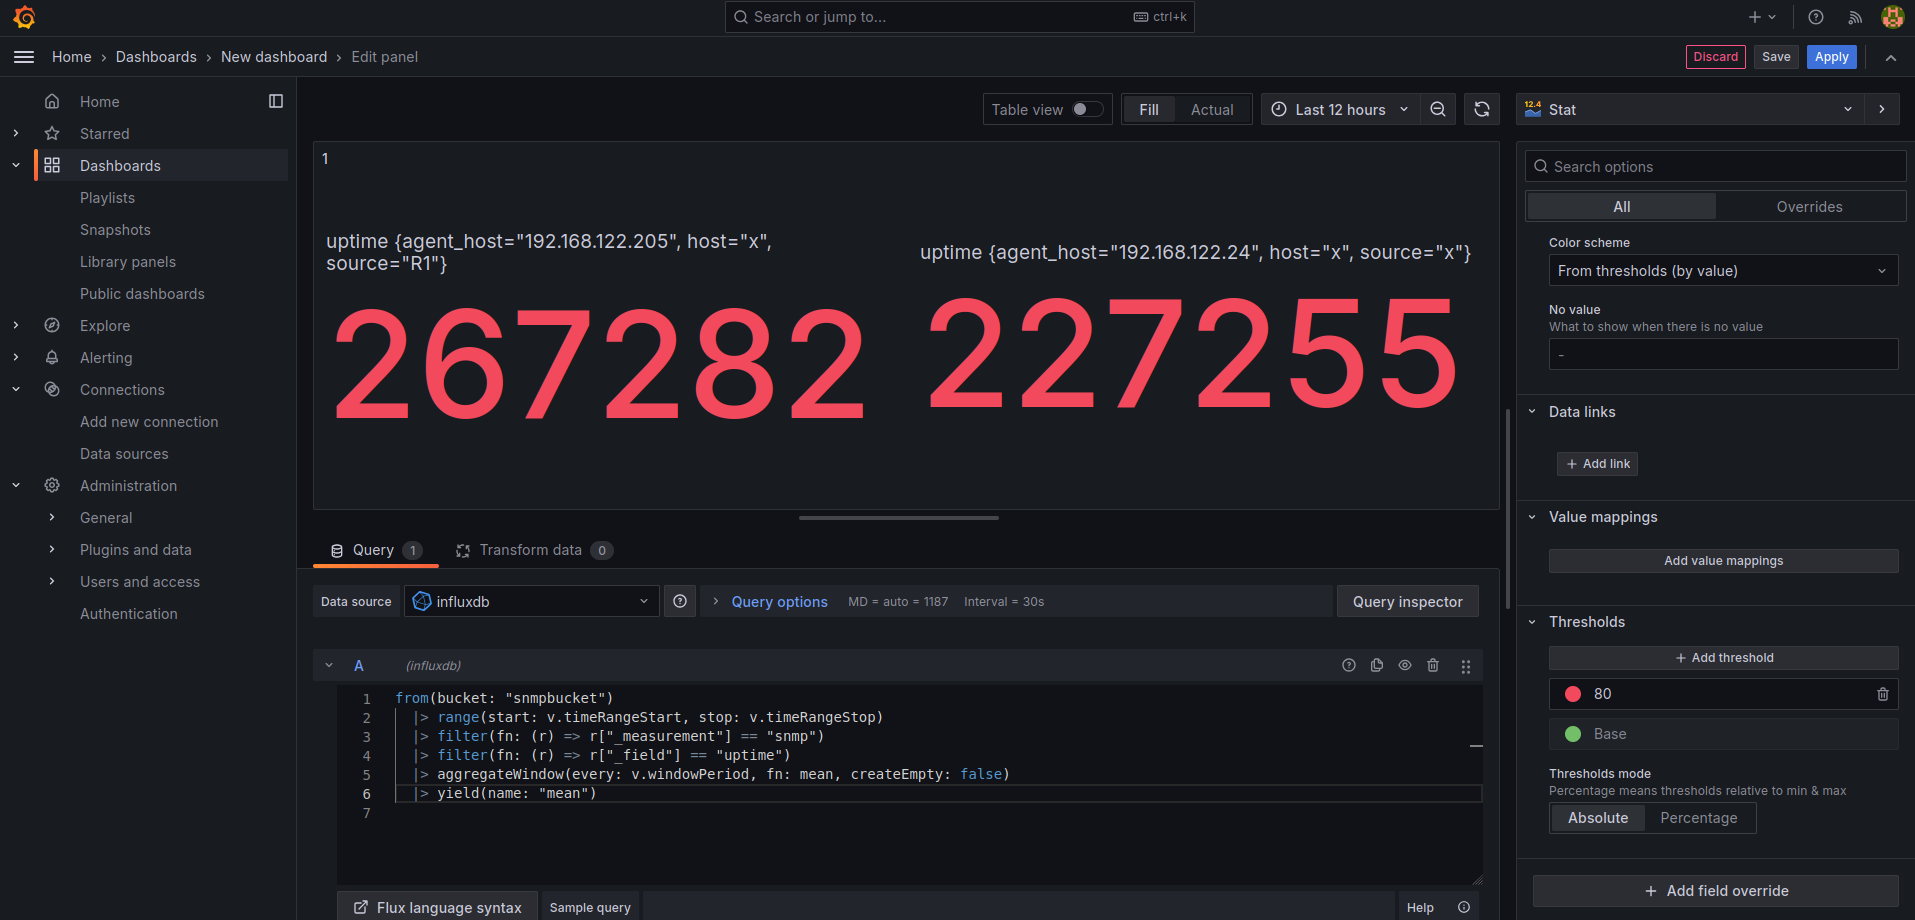
Here is my query to get the uptime of my devices.
from(bucket: "snmpbucket")
  |> range(start: v.timeRangeStart, stop: v.timeRangeStop)
  |> filter(fn: (r) => r["_measurement"] == "snmp")
  |> filter(fn: (r) => r["_field"] == "uptime")
  |> aggregateWindow(every: v.windowPeriod, fn: mean, createEmpty: false)
  |> yield(name: "mean")
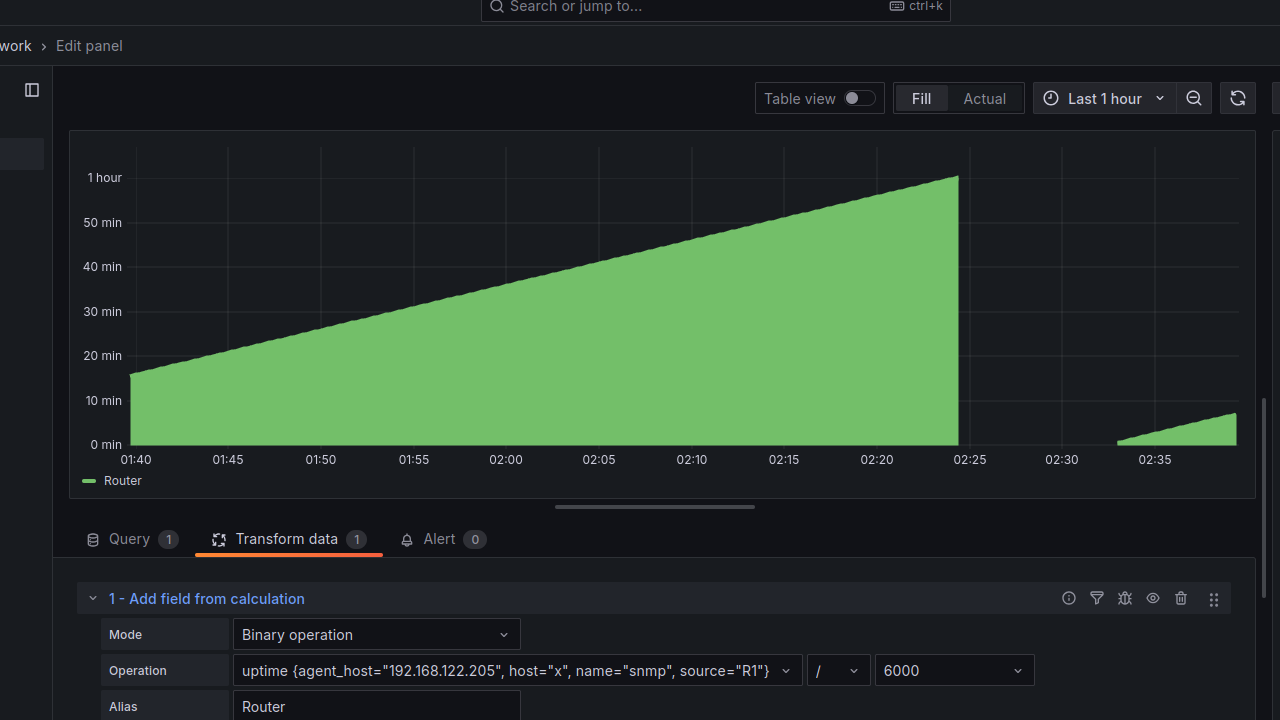
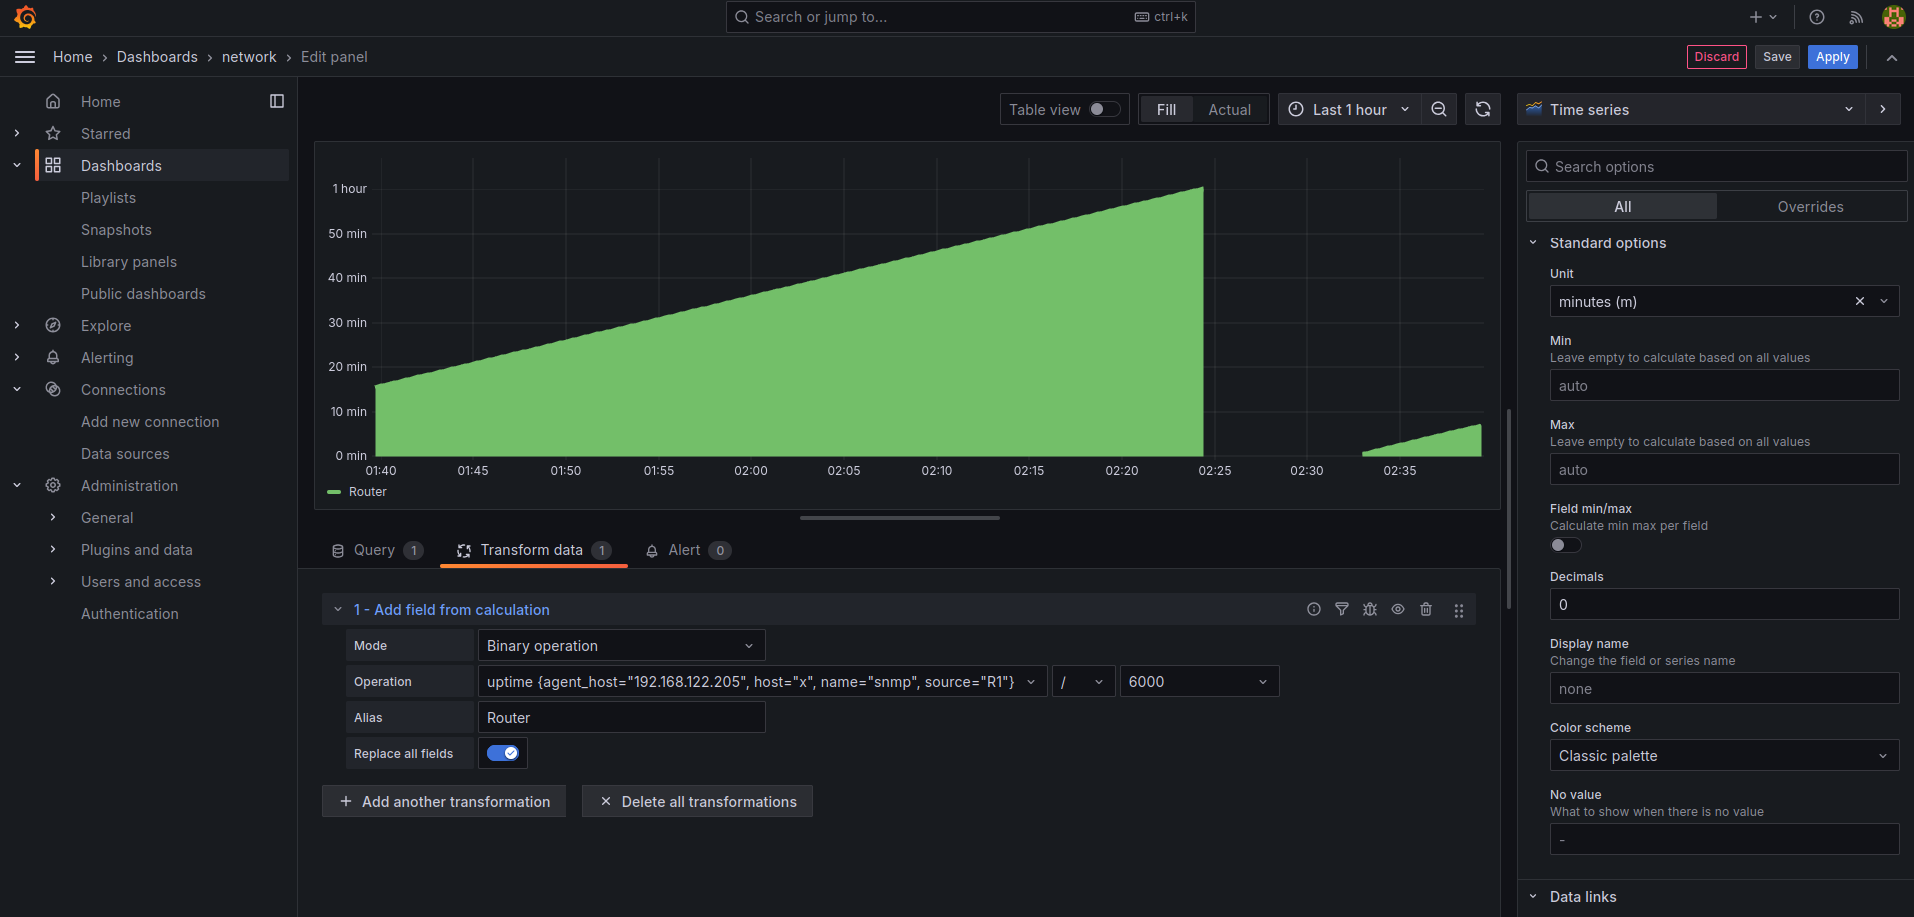
I add a transformation to adjust the SNMP time tickers and that's it!
Side Notes
SNMP time tickers
timeticks / 100 = seconds
timeticks / 6000 = minutes
timeticks / 360000 = hours
timeticks / 8640000 = days
SNMP agent on Ubuntu
sudo apt install snmpd
code /etc/snmp/snmpd.conf
systemctl restart snmpd
ufw allow 161/udp
ufw allow 162/udp
/etc/snmp/snmpd.conf
#agentAddress udp:127.0.0.1:161
agentAddress udp:161,udp6:[::1]:161